Log Analysis Guide
This comprehensive guide covers log analysis in the Nginx WAF Management Platform, including viewing different log types, filtering and searching logs, analyzing security events, and troubleshooting issues through log data.
Overview
The log analysis system provides:
- Centralized Logging: Access to all system logs in one interface
- Real-time Viewing: Live log streaming for real-time monitoring
- Advanced Filtering: Filter logs by type, domain, time range, and more
- Search Capabilities: Search logs using keywords and patterns
- Security Analysis: Identify security threats and attack patterns
- Export Functionality: Export logs for external analysis
Log Analysis Interface
Access log analysis by clicking Logs in the sidebar navigation:
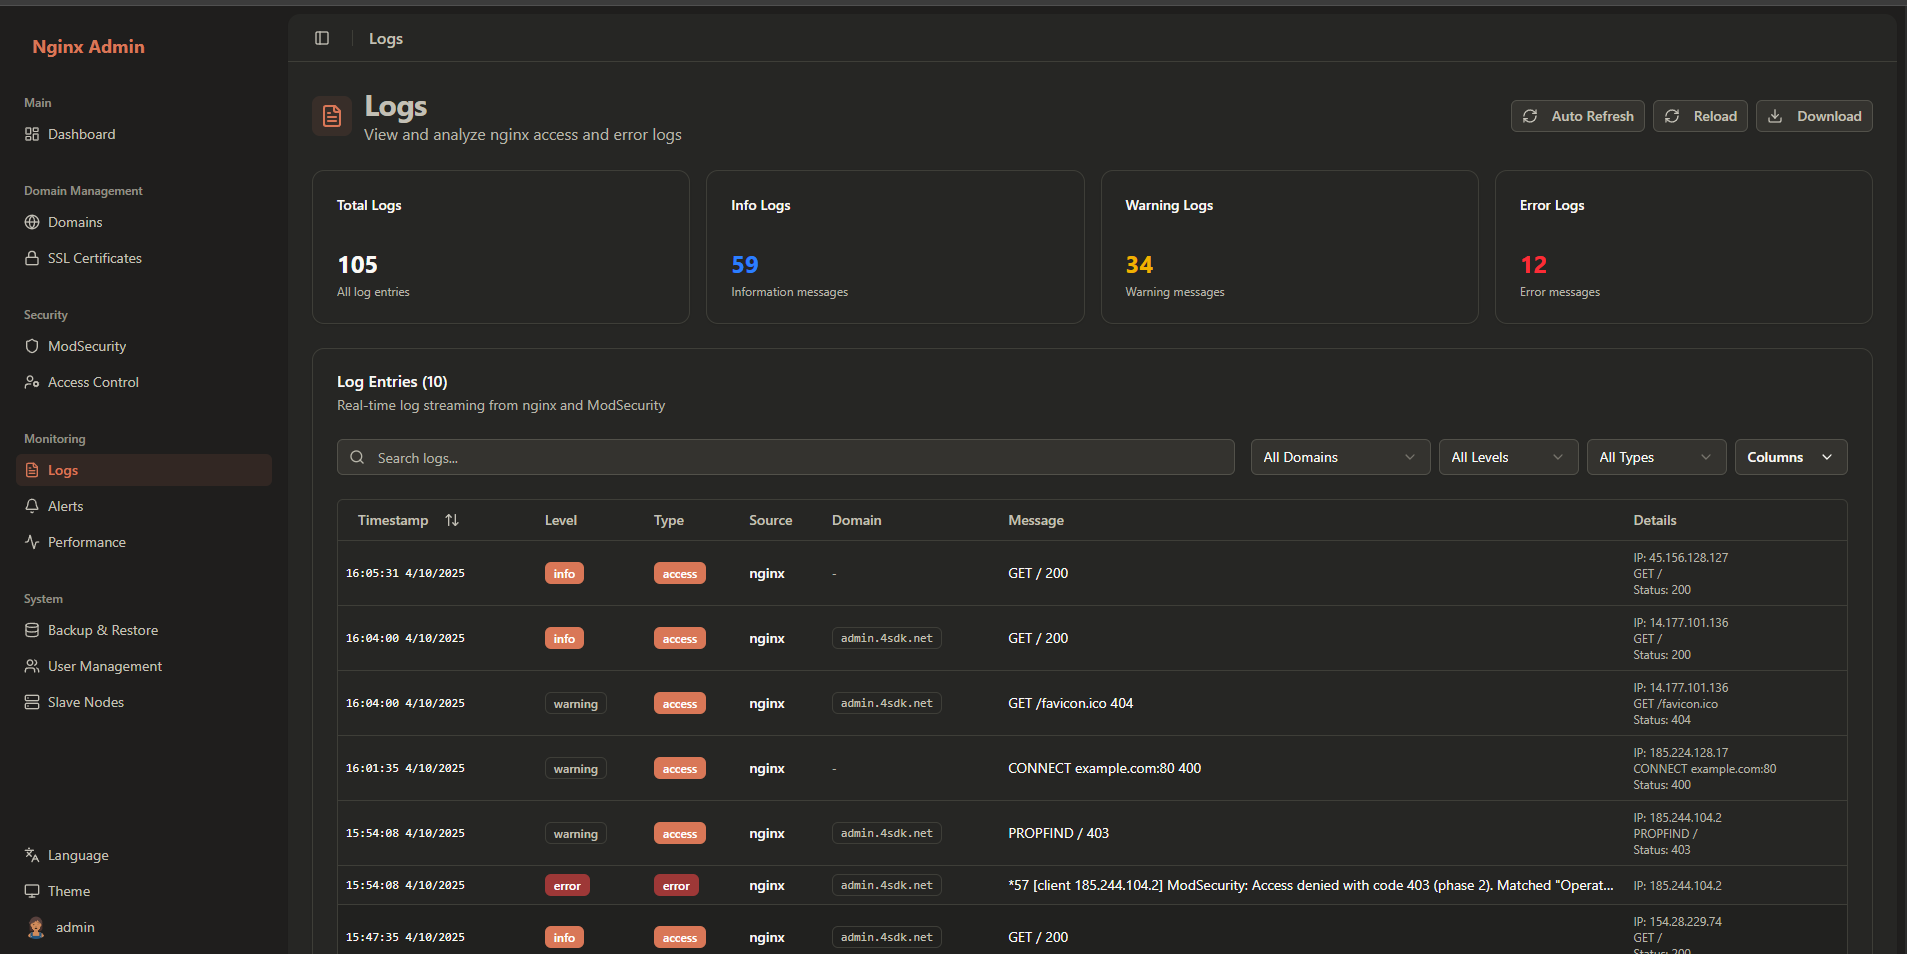
The log analysis interface provides:
- Log Type Selection: Choose between different log types
- Filter Options: Filter logs by various criteria
- Search Bar: Search for specific log entries
- Log Display: Formatted log entries with highlighting
- Export Options: Download logs in various formats
Log Types
The platform collects and analyzes several types of logs:
Access Logs
Access logs record all HTTP requests to your domains:
Log Format:
192.168.1.100 - - [04/Oct/2025:10:00:00 +0000] "GET /api/users HTTP/1.1" 200 1234 "https://example.com/dashboard" "Mozilla/5.0 (Windows NT 10.0; Win64; x64) AppleWebKit/537.36"Access Log Fields:
- Remote Address: Client IP address
- Remote User: Authenticated username (if any)
- Timestamp: Request date and time
- Request: HTTP method, path, and protocol
- Status: HTTP response status code
- Body Size: Response body size in bytes
- Referer: Referring page
- User Agent: Client browser information
Error Logs
Error logs record server errors and issues:
Log Format:
2025/10/04 10:00:00 [error] 1234#0: *1 connect() failed (111: Connection refused) while connecting to upstream, client: 192.168.1.100, server: example.com, request: "GET /api/data HTTP/1.1", upstream: "http://192.168.1.200:8080/api/data"Error Log Fields:
- Timestamp: Error date and time
- Log Level: Error severity (error, warn, info, debug)
- Process ID: Nginx process ID
- Connection ID: Connection identifier
- Error Message: Detailed error description
- Client Information: Client IP and request details
- Upstream Information: Backend server details
ModSecurity Logs
ModSecurity logs record security events and rule matches:
Log Format:
[04/Oct/2025:10:00:00 +0000] [-] [error] [client 192.168.1.100] ModSecurity: Access denied with code 403 (phase 2). Matched "Operator `Rx' with parameter `(?i:(?:[.;&\\|`'"]|(?:%[0-9a-f]{2}))+select(?:[\\s]+(?:distinct|all))?)" against variable "ARGS:sql" (Value: "';SELECT * FROM users;--") [file "/etc/nginx/modsec/REQUEST-942-APPLICATION-ATTACK-SQLI.conf"] [line "173"] [id "942100"] [rev ""] [msg "SQL Injection Attack Detected"] [data "Matched Data: ';SELECT found within ARGS:sql"] [severity "CRITICAL"] [ver "OWASP_CRS/3.3.0"] [tag "application-multi"] [tag "language-multi"] [tag "platform-multi"] [tag "attack-sqli"] [tag "OWASP_CRS/WEB_ATTACK/SQL_INJECTION"] [tag "WASCTC/WASC-19"] [tag "OWASP_TOP_10/A1"] [tag "OWASP_AppSec/REGEX/941100"] [hostname "example.com"] [uri "/api/search"] [unique_id "X123456"]ModSecurity Log Fields:
- Timestamp: Event date and time
- Client IP: Source IP address
- Action: Action taken (deny, allow, etc.)
- Phase: Processing phase (1-5)
- Match Details: Rule match information
- Rule Information: Rule ID, file, line number
- Message: Rule description
- Data: Matched data
- Severity: Event severity
- Tags: Event tags and categories
System Logs
System logs record application and system events:
Log Format:
2025-10-04T10:00:00.000Z [INFO] (nginx-waf-api) User admin logged in successfully from 192.168.1.100System Log Fields:
- Timestamp: Event date and time (ISO 8601)
- Log Level: Event severity (INFO, WARN, ERROR, DEBUG)
- Source: System component generating the log
- Message: Event description
- Details: Additional event data
- Domain: domain log
Viewing Logs
Filtering Logs
Filter logs to find specific information:
By Domain
- Select a domain from the Domain dropdown
- Only logs for that domain will be displayed
- Select "All Domains" to view logs for all domains
By Log Level
- Select log levels from the Log Level dropdown:
- Error: Error messages and critical issues
- Warning: Warning messages and potential issues
- Info: Informational messages
Searching Logs
Search for specific log entries using the search bar:
Text Search
Enter keywords to search for in log messages:
search termFor more information on related topics: