Performance Monitoring Guide
This comprehensive guide covers performance monitoring in the Nginx WAF Management Platform domain performance tracking and performance optimization.
Overview
The performance monitoring system provides:
- Real-time Metrics: Live system and domain performance data
- Historical Analysis: Performance trends over time
- Alert System: Configurable alerts for performance issues
- Performance Reports: Detailed performance analytics
- Bottleneck Identification: Tools to identify performance issues
- Capacity Planning: Data for scaling decisions
Performance Monitoring Interface
Access performance monitoring by clicking Performance in the sidebar navigation:
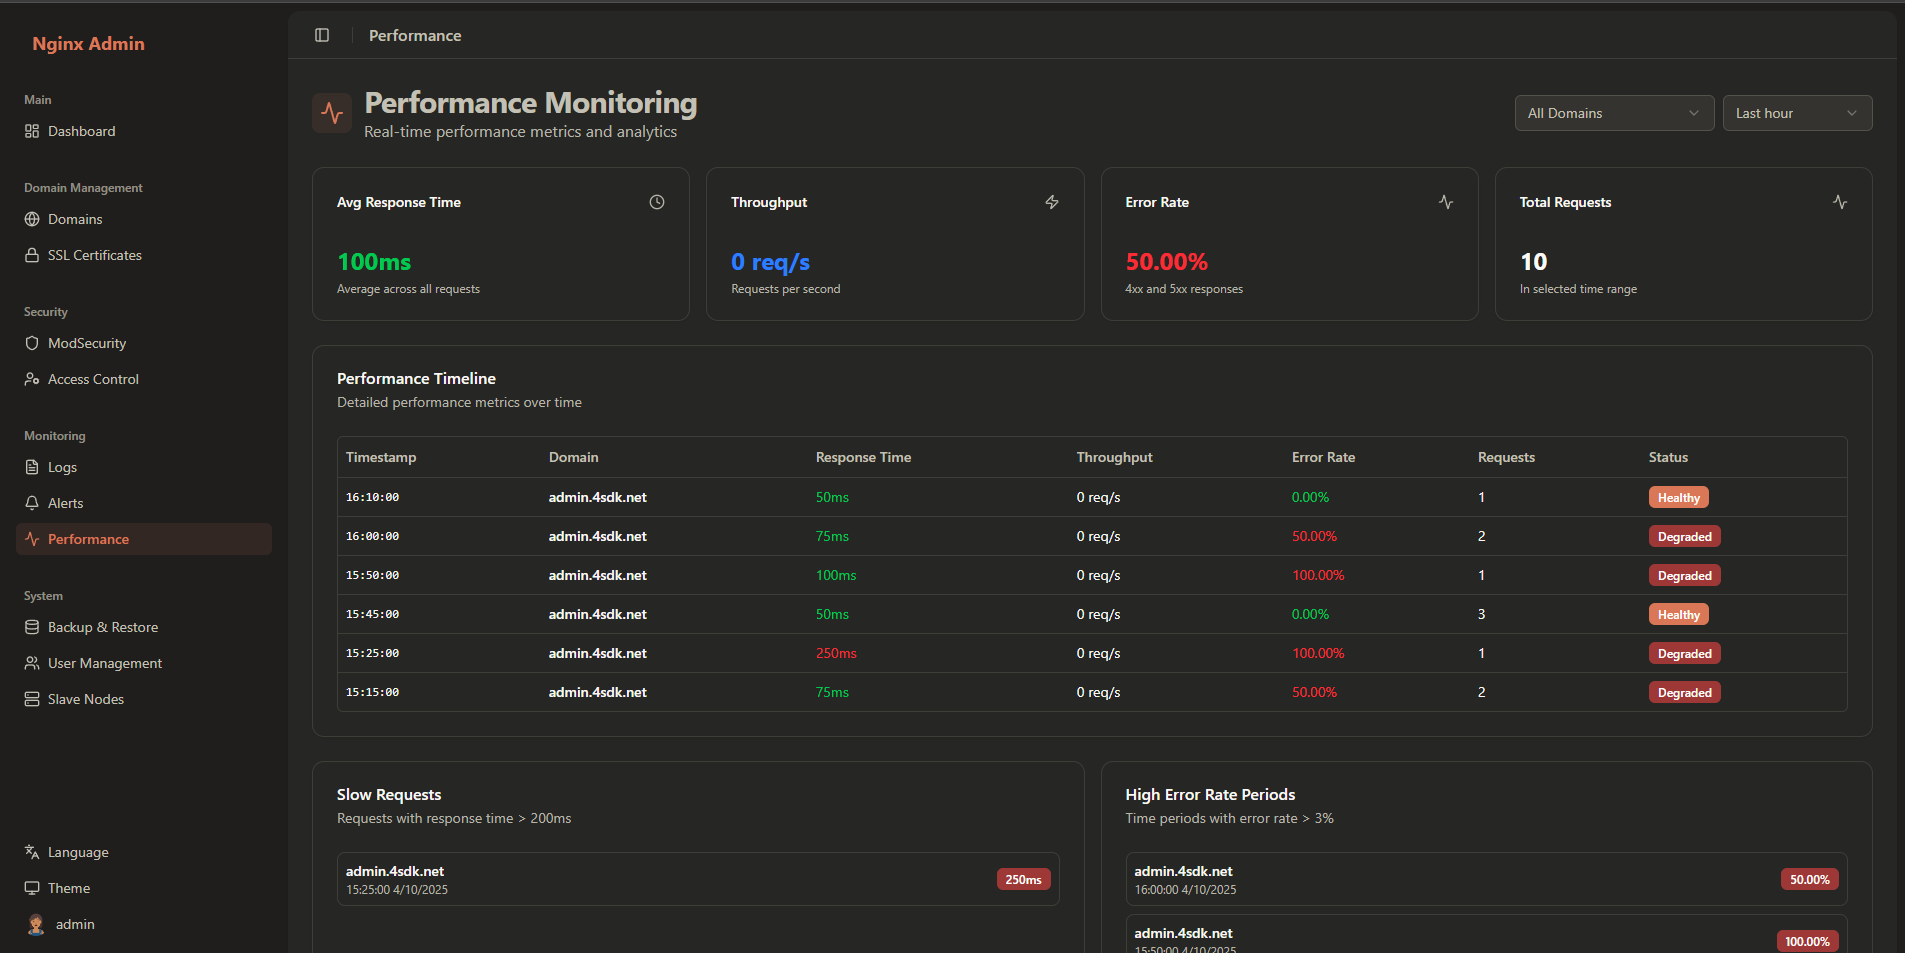
The performance interface provides:
- Domain Performance: Request rates, response times, error rates
- Historical Data: Performance trends over time
- Alert Status: Active and recent performance alerts
Alert Configuration
Configure alerts to notify you of performance issues:
Creating Alert Rules
- Click Alerts in the sidebar
- Go to Alert Rules tab
- Click Add Alert Rule
- Configure alert parameters:
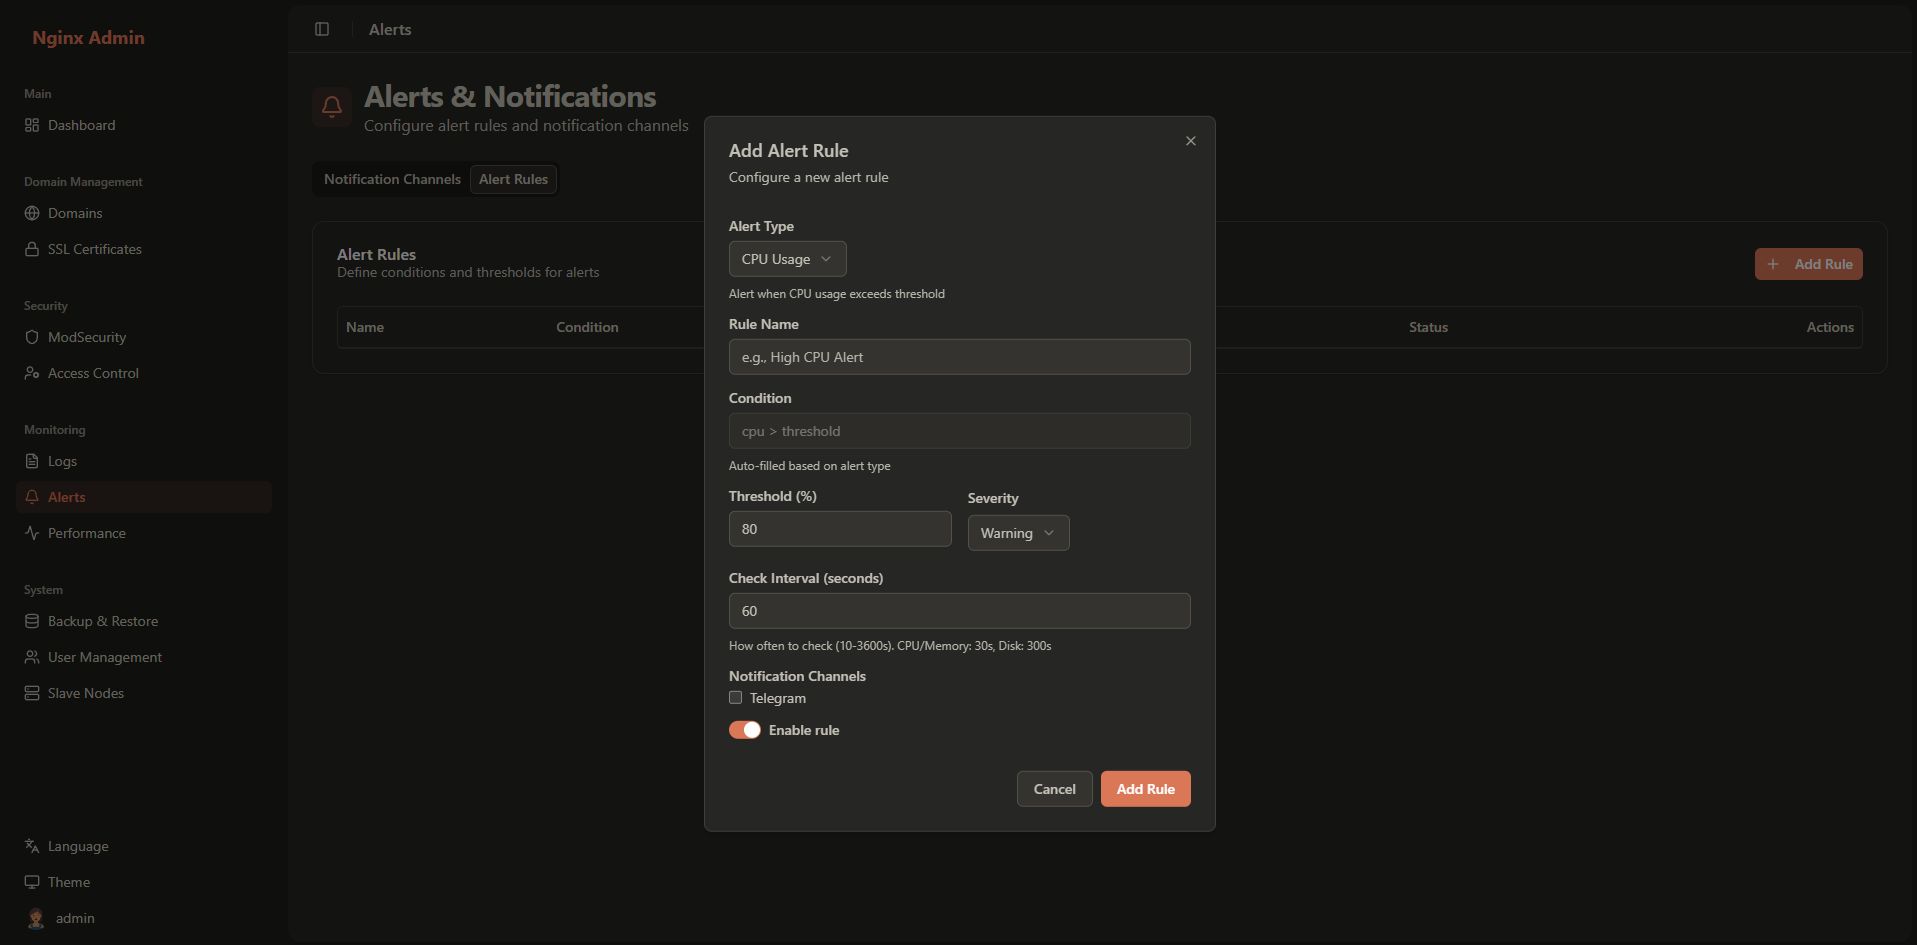
Alert Configuration:
- Name: Descriptive alert name
- Condition: Performance metric to monitor
- Threshold: Alert trigger value
- Severity: Critical, warning, or info
- Check Interval: How often to check the condition
Example Alert Rules:
- High CPU Usage:
Name: High CPU Usage
Condition: cpu > 80
Threshold: 80%
Severity: Warning
Check Interval: 10 seconds (5 minutes)
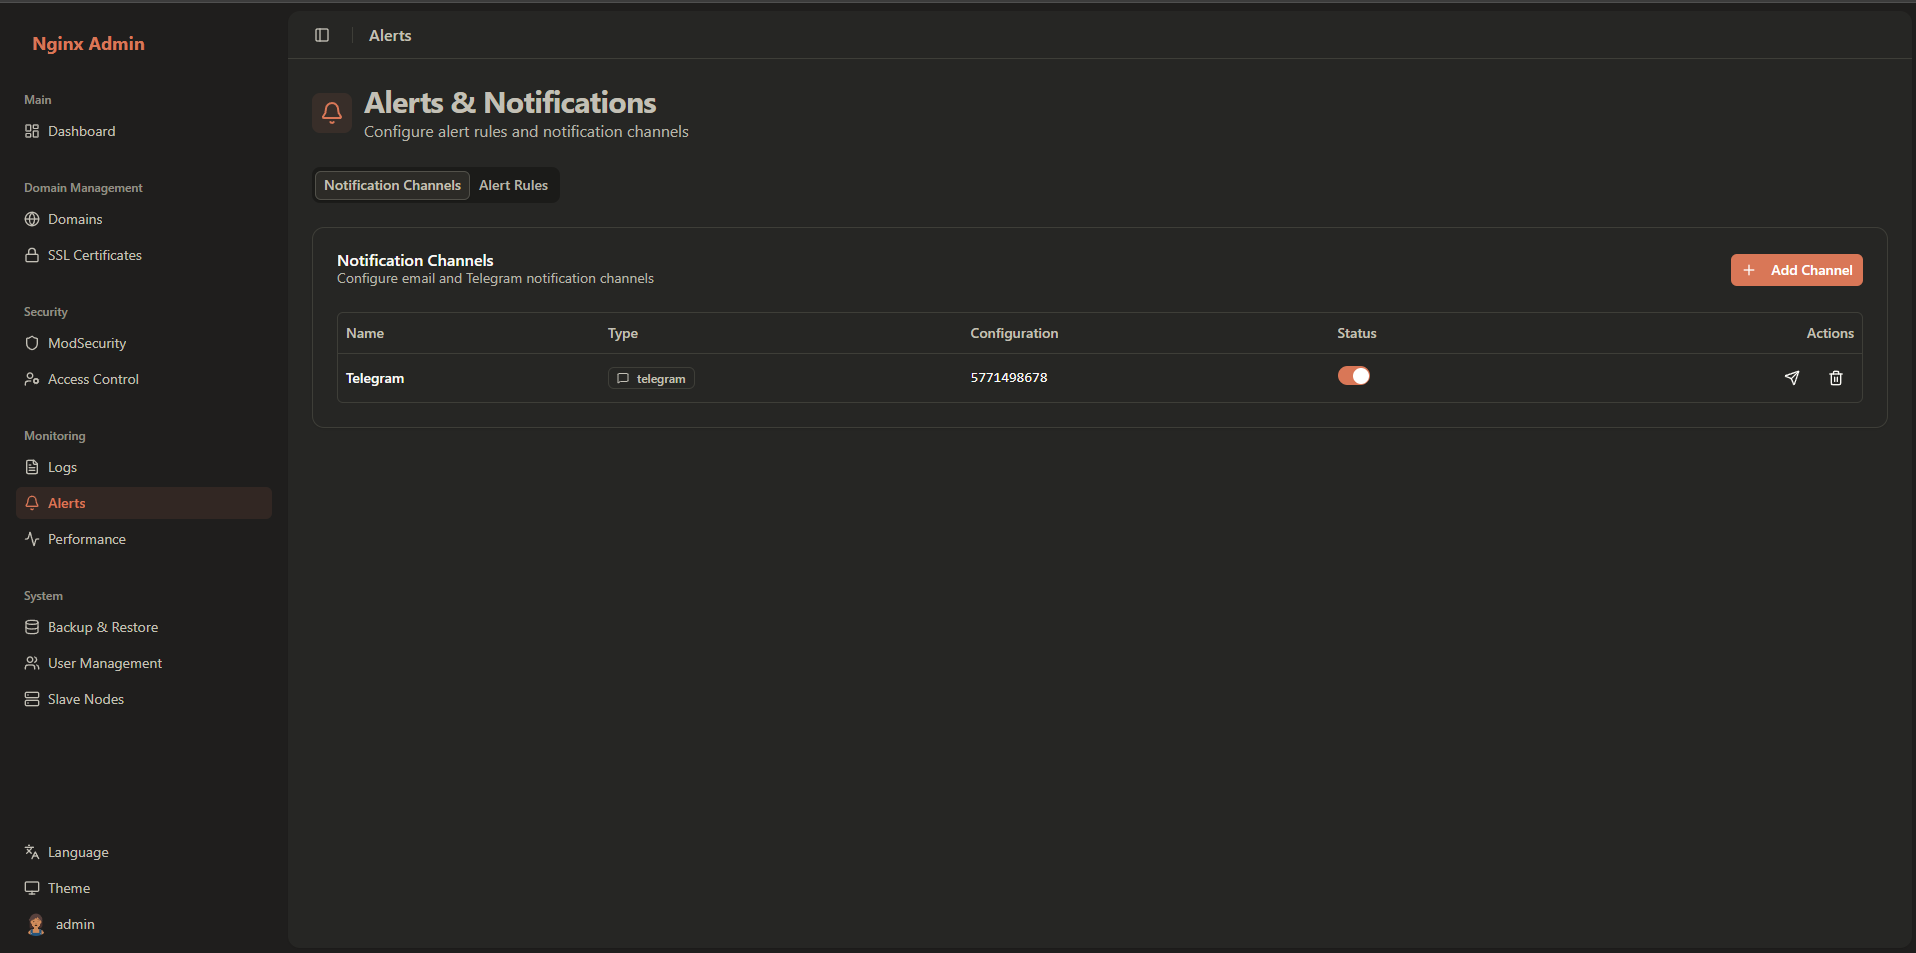
Notification Channels
Configure how alerts are delivered:
Email Notifications
- Click Alerts in the sidebar
- Go to Notification Channels tab
- Click Add Channel
- Select Email as channel type
Email Configuration:
- Name: Channel name (e.g., "Email Alerts")
- Recipients: Email addresses to receive alerts
Telegram Notifications
- Click Add Channel
- Select Telegram as channel type
Telegram Configuration:
- Name: Channel name (e.g., "Telegram Bot")
- Bot Token: Telegram bot token
- Chat ID: Telegram chat ID for notifications
For more information on related topics: